 |
| Radar Image with Overlays |
 |
| Chart with Radar Overlay at Left, Data Screen at Right |
 |
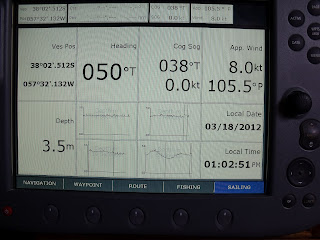
| Data Page with Depth Graphs |
I was at the companionway having a coffee and toast still wondering why the C120 was not reporting AIS targets when I saw the dredging ship on the move only a few hundred meters from the boat. Surely it would have its AIS on. Down below the C120 reported nothing. That settled it. For two days I had been holding back on the unlikely possibility that no boat in the harbor had its AIS on, but that ship on the move blew away that possibility.
I went over the problem in my head. The Comar CSB200 AIS is a stand alone 3rd party product with its own dedicated VHF and GPS antennas. It had not ceased functioning during the radar and autopilot problems. The only commonality with the Radar problem was the cable from the Comar plugged into the C120's NMEA input plug. I had check the connection and it was firm, and it was highly unlikely that the repair effort had damaged the interface.
Then the flicker of a memory came up: La Paz about 2 years ago, when I recovered from the one and only software crash of the C120 by resetting it to factory settings. I remembered that there had also been a problem with the AIS.
I hit the “menu” button on the C120, selected “System Setup” then selected “System Integration” as a likely solution. That brought a menu that included “NMEA Port Setting” (Getting warm now!). It was set to “NMEA 4800”, no doubt the default for a Raymarine AIS. I selected “AIS 38400” and returned to the normal display to find my self in a nest of 29 AIS targets within a radius of 1.5 miles. Soon the AIS alarm sounded because the dredger was moving within my safety zone. That would have to be something to remember: if the CS120 goes into a workshop it will likely return with factory defaults.
The night before I had spent a very productive 2 hours getting to know the radar unit better. I learned how to set the VRM (Variable Range Marker) and EBL (Electronic Bearing Line) to get a more precise range and bearing of a target (which can also be done with the cursor). I learned how to define a safety zone either as a circle around the boat or just a sector, then how to select a target (it takes 3 successful sweeps to lock in on it) and have it tracked. Thereafter a vector is displayed showing the likely direction of the target and I can set up an AIS type dangerous target alarm if it is going to come too close. I tried overlaying the AIS targets on the radar display and that worked fine. The photograph of the radar screen shows the purple VRM circle and EBL line that cross at the the target at the bottom right of the screen. The lines may be difficult to see but the data at the bottom tells the story: the target is 0.9 nm away bearing 136 degrees to starboard. It is the grain silo. In that radar shot you can also see the harbor breakwater at the top right and the entrance to the harbor at the end of it.
Then I fiddled around with creating and editing C120 page sets, pages, and application windows within pages. I created a data screen, sliced it up into appropriate rectangles, then populated the rectangles with the data that suited my needs. For the first time I could see vital depth information concurrently with the other data on position, course, heading, speed, wind, etc. I was surprised to see that along with the depth number it was possible to display graphs of the recent history of depths, with points of data every second, 10 seconds, 1 minute, and 5 minutes. The 1 second graph is for close in work and covers a span of perhaps 5 minutes. The 5 minute graph covers hours, long enough for me to see the diurnal pattern of the tide. The photograph of the data window shows the 4 depth graphs that will be of great help to me in the future. There is another photo where I have split the C120 screen with the chart display (overlaid with radar and AIS data) on the left and the data on the right.
I finished off by turning on the “timed transmit” feature (for my first time ever), and setting the radar to do 10 sweeps every 3 minutes (options are 10, 20, or 30 scans every 3, 5, 10, or 15 minutes). That worked fine and I expect to use this feature in the future. I'll overlay it with the chart display so that every few minutes I can see what is out there.
I also reviewed the settings for gain, sea clutter, rain or snow clutter, interference from other radars, etc.
I'm regret to admit that it has taken me over 3 years to sit down and really get to know both the C120 display and the radar unit. Now finally I can exploit all of their features.

1 comment:
TRUE: there is nothing like a good night's sleep for solving problems... excellent news
Post a Comment